

About concept maps
This feature is available in NVivo Pro and Plus editions. Learn more
You can use a concept map to map out your ideas or to explore and present the connections in your theories. Use shapes and connectors to visualize and organize your knowledge.
In this topic
Watch the video
What are concept maps?
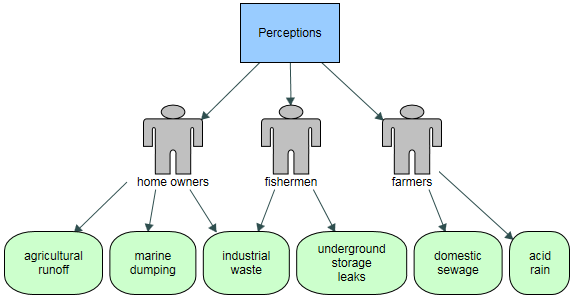
A concept map is a free-form visualization made up of different shapes and connectors.
Shapes represent concepts (ideas, people, or data). The connectors between the shapes articulate links such as this causes..., this requires... or this contributes to....
To get started with a concept map, try one of the following approaches:
-
Identify a list of relevant concepts and/or people. Put them on shapes and move them around the canvas to get a sense of grouping and order. What else might be associated with them? Add additional items. Connect each concept to show associations.
-
Take something you've already written and try to map it.
-
Try visualizing how you see a case. Add different shapes to the map to represent what impacts or is impacted by the case.
You can add project items to concept maps to help build your diagram.
Your map doesn't have to be complete to start with. As you gather data, add project items to your concept map to flesh out your visualization and help you with your analysis. A good way to see if you are on track is to have colleagues check your diagram—can they interpret it?
When you create concept maps, save an image in your project journal and record your observations and insights.

When should I create a concept map?
| At this stage of your project | Create a concept map to |
|
Early on |
|
|
During analysis |
|
|
Developing theory |
|
|
Presenting results |
|
Examples of concept maps
Concept maps are very flexible and can be used for a variety of purposes. For example, you might make a concept map to:
-
Record theoretical groups of the categories and concepts contained in your research question.
-
Sketch the relative locations of sites, events or people in your project, as observed by yourself or described by others.
-
Demonstrate your theory about a pattern or pathway.
-
Sum up the key elements of a process you have identified.
-
Draw a timeline to show historical development of a situation or sequence of events.
-
Map the logic used by a participant for the decisions they've made.